Coming soon
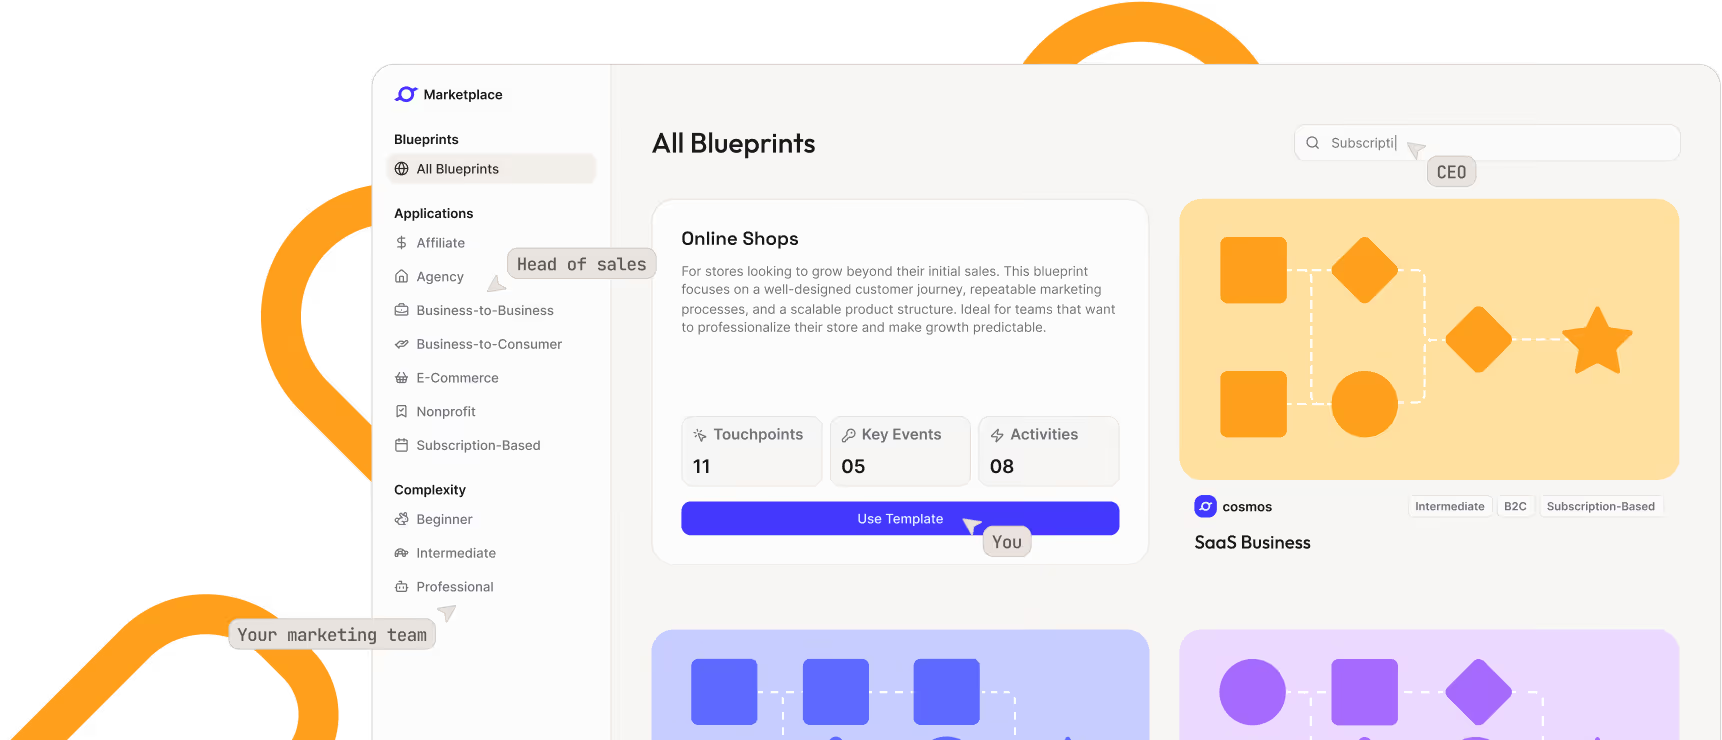
Blueprints for a quick start with your strategy
Look forward to business blueprints – for instant inspiration and an immediate, data-ready cosmos
Discover upcoming features
Discover upcoming features
.png)
Visually and interactively reworked – and significantly faster.
.png)
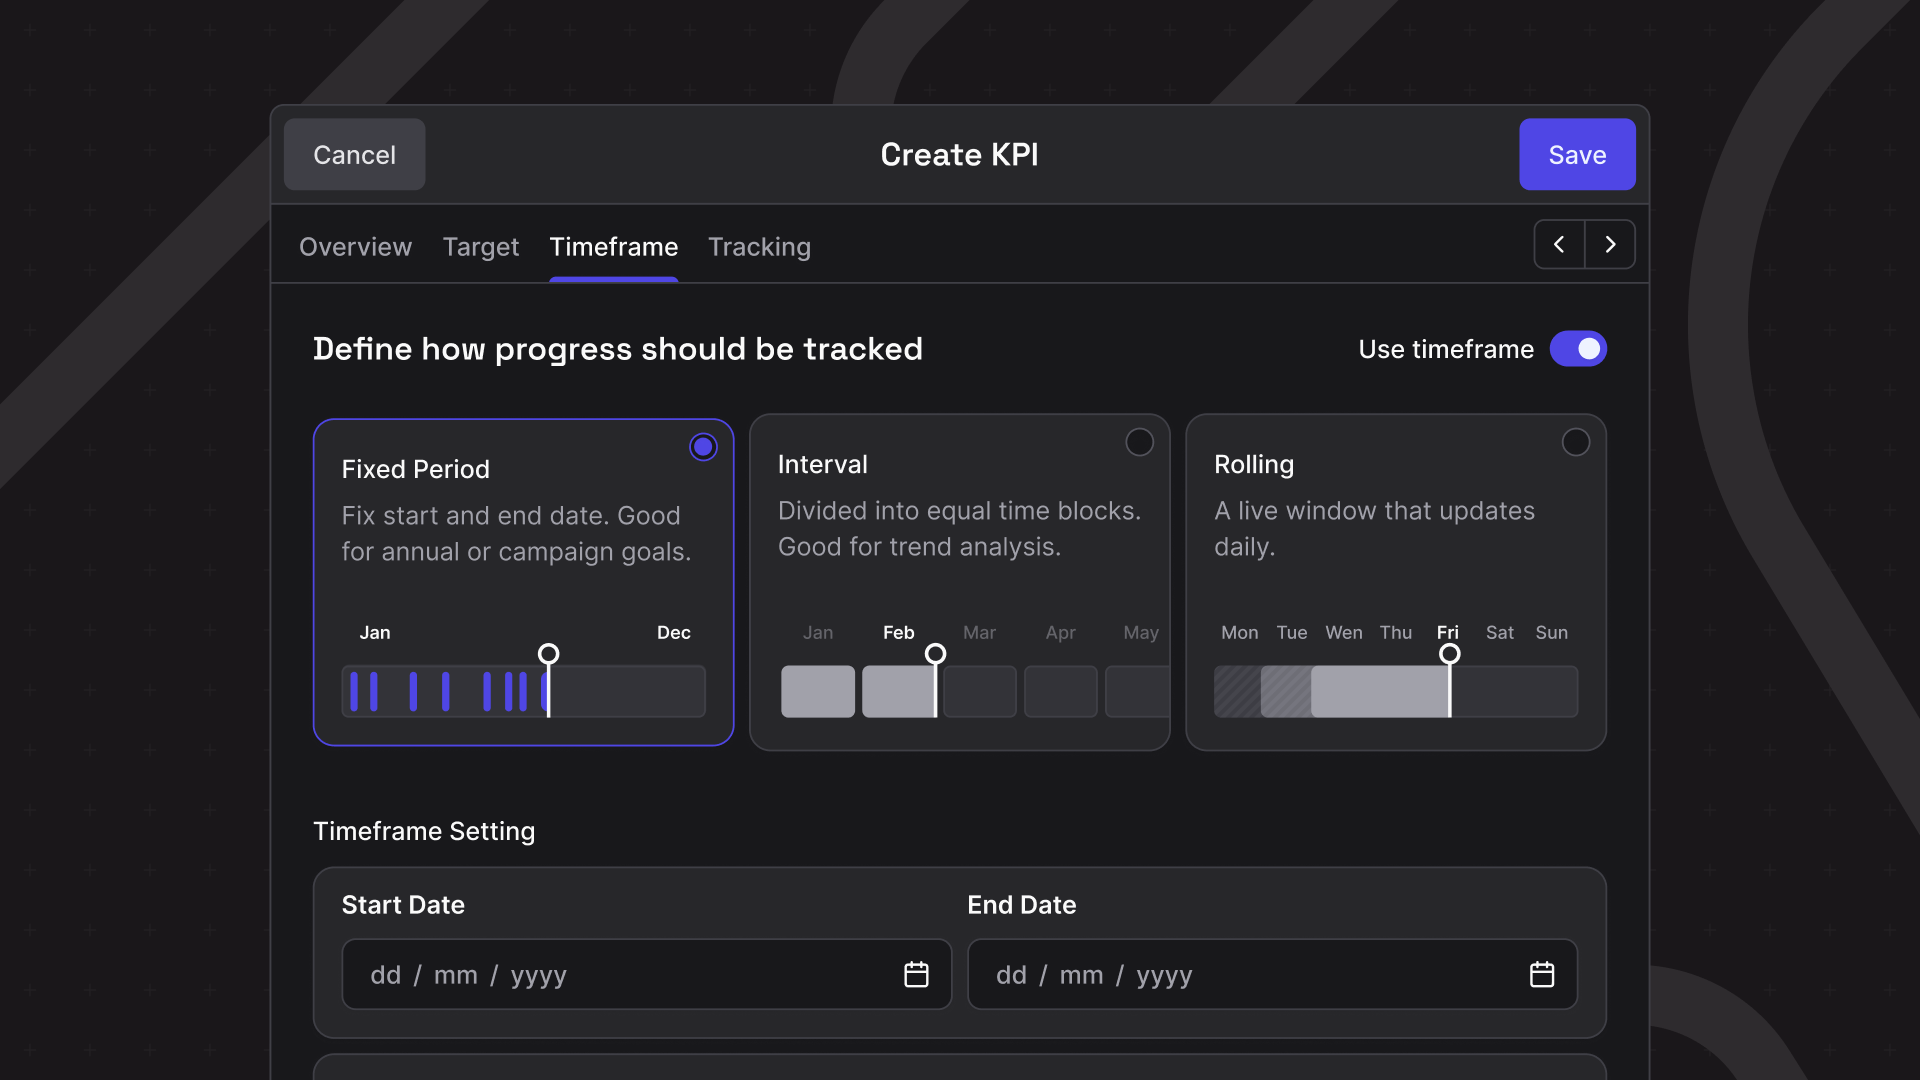
What used to be split across multiple steps is now one continuous flow. A new KPI only needs a name – fill in the rest when you're ready.
Your home in cosmos™ has a cleaner layout and a better overview of performance at a glance. Product updates always in sight, Export Hub one click away.
.png)
.png)
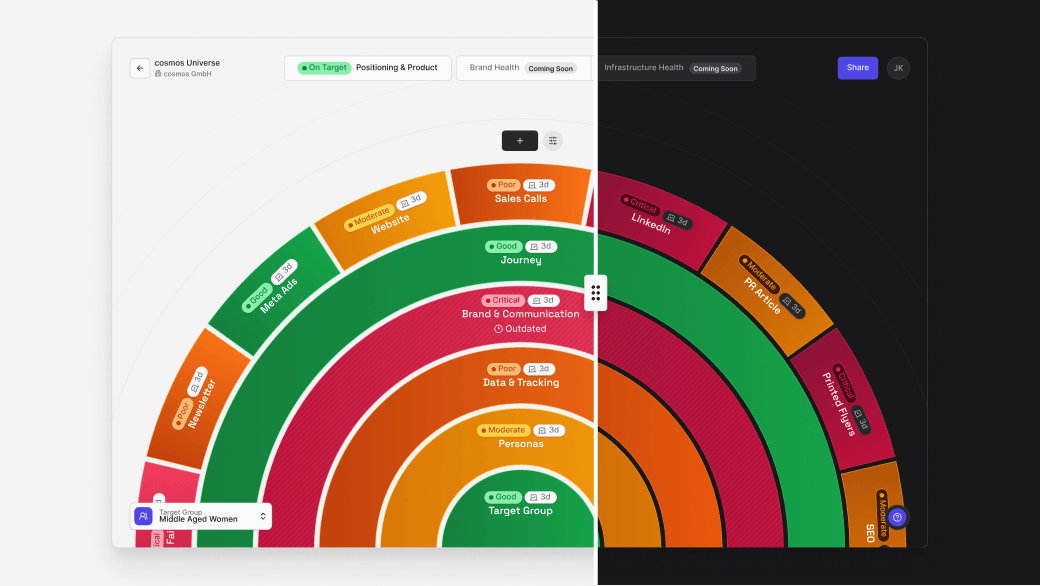
With the new TargetLens™ configuration, you build each Lens exactly around what it takes to achieve your specific target. A Go-to-Market Lens looks different from a Sales or Stakeholder Lens – so now each role or department sees exactly the contributions and influencing factors relevant to their decisions. Nothing more. Nothing less.
Every Ring Module serves a specific strategic purpose. Combine only the ones that matter for this target.
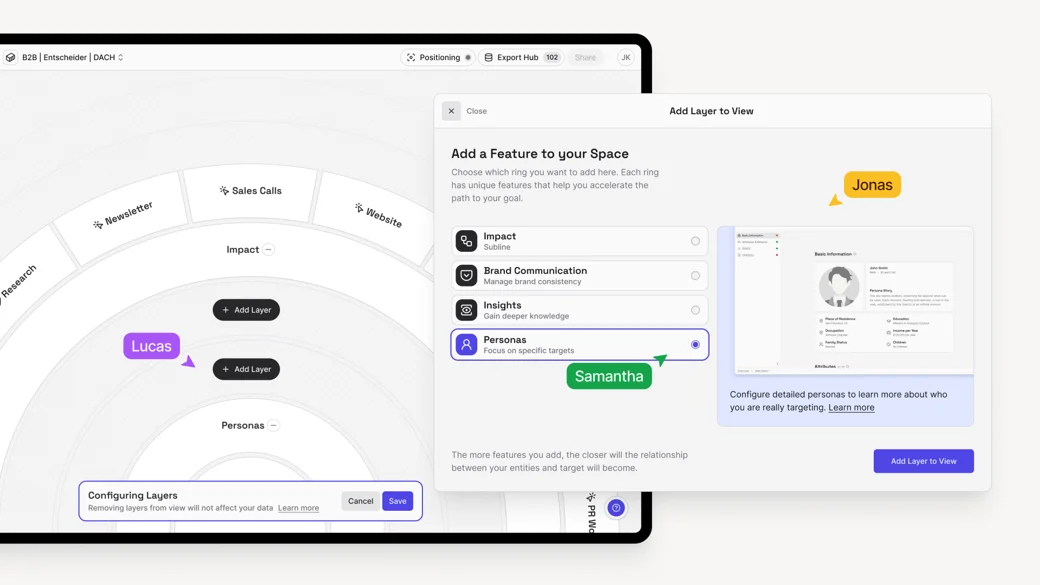
Goals don't exist in isolation. You can now link TargetLenses directly to each other to visualize their strategic relationships and dependecies. A goal in one TargetLens™ can be a tangible contribution in another. You always know how your goals relate to each other – and move between them without losing context.
.webp)
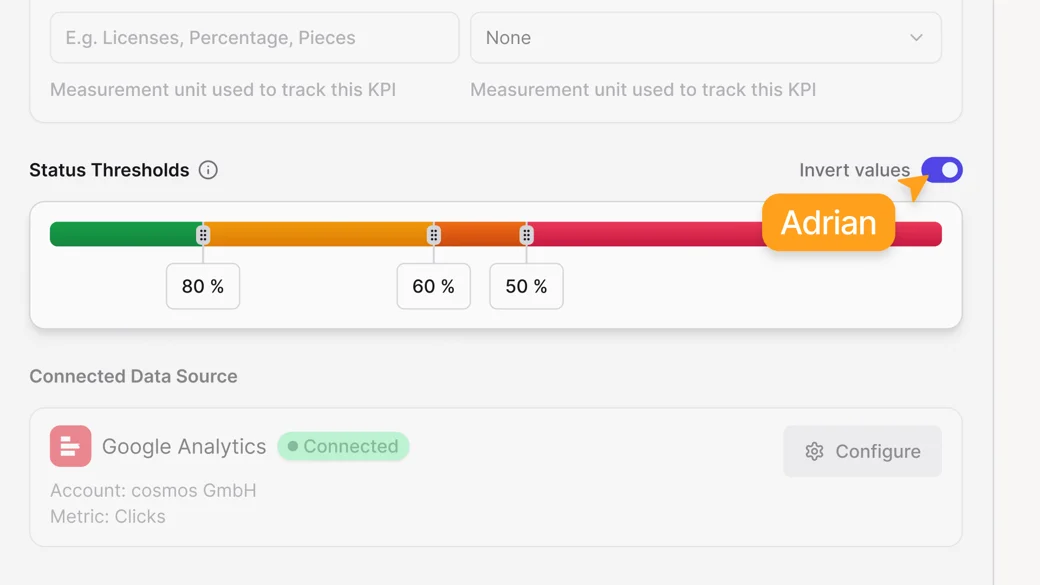
Not every KPI should go up. Costs, error rates, churn – for these metrics, a lower value is the goal. With Inverted KPIs, you can now model exactly that: click "Invert Value" in the edit mode of your KPI, set the target you want to stay below, and cosmos™ evaluates progress accordingly.
.png)
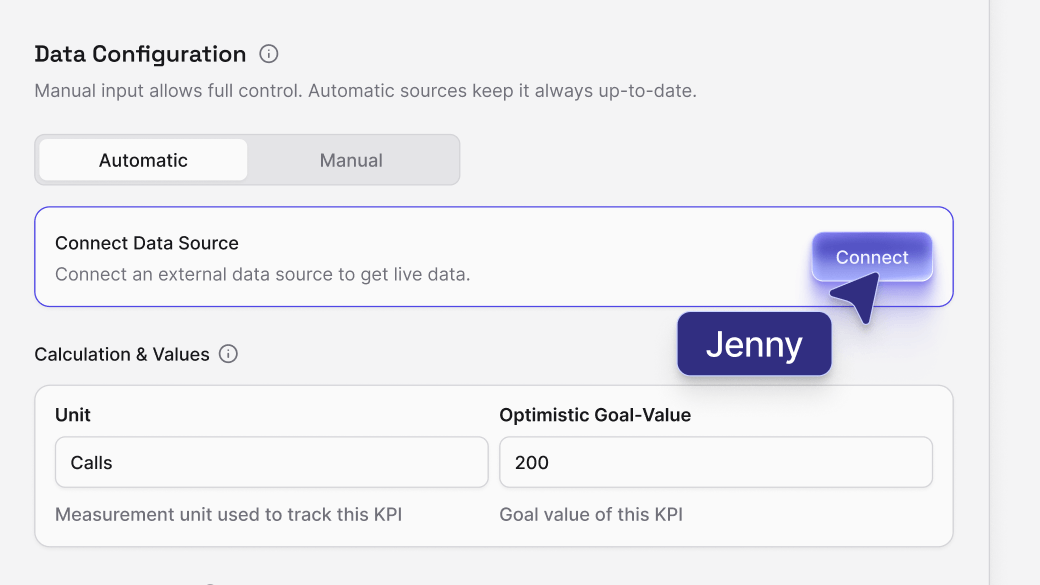
Stay data-driven without manual effort: connect any internal or external data source – from ad managers and analytics tools to CRMs – directly to your KPIs. cosmos™ enables fully automated updates of your key performance indicators in any custom rhythm: fixed time frames, recurring intervals, or dynamic rolling windows.
Define exactly which data you need, where it comes from, and how often it refreshes – cosmos™ takes care of the rest. Your KPI cosmos becomes a living, self-updating ecosystem.
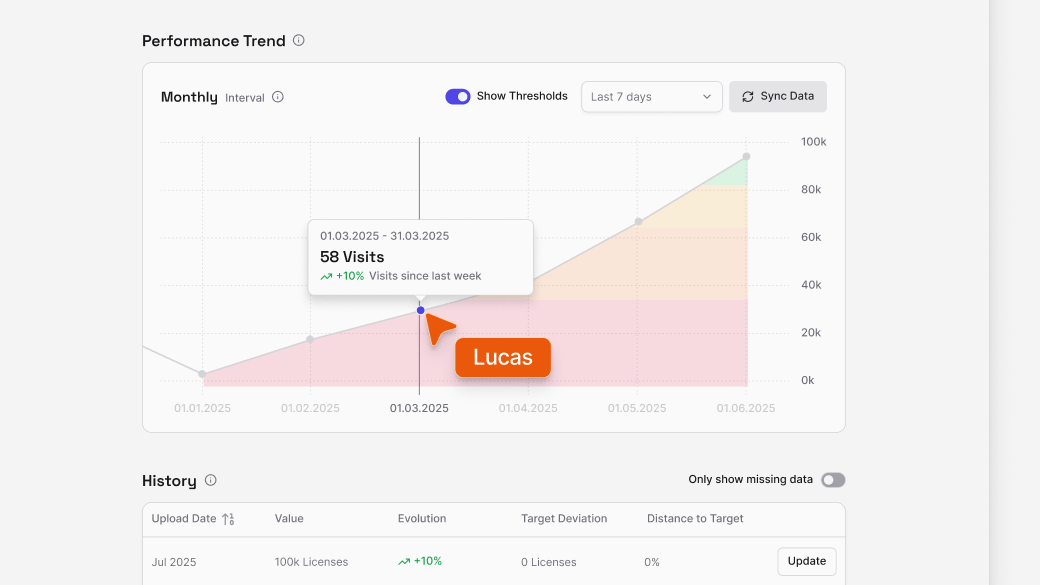
Every KPI now comes with its own historical timeline. All updates are stored automatically and displayed as a dynamic trend curve across selected time periods. See long-term developments, track the impact of strategic changes, and visualize progress directly within your impact chain. In addition, you can now define precise percentage thresholds for each status level (critical, poor, moderate, good) and see them directly next to the KPI.
.png)
Work the way you like: switch seamlessly between light and dark modes to match your environment or personal preference.
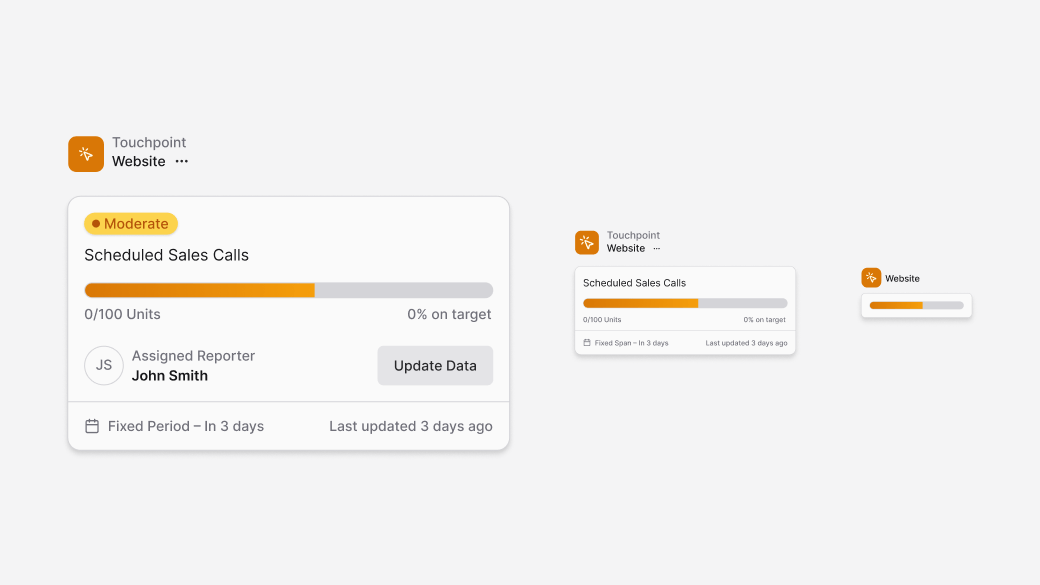
You can now zoom through your KPI map with dynamic Level of Detail states. The further you zoom out, the more simplified each element becomes – helping you stay oriented at a glance. Zoom in for full context when you need detail.
.png)
You can now manage your account in an even more flexible and structured way – from user roles to multiple independent workspaces under one company account.