Wolf Albrecht
Group Leader Global Online Marketing
Dr. Beckmann Group
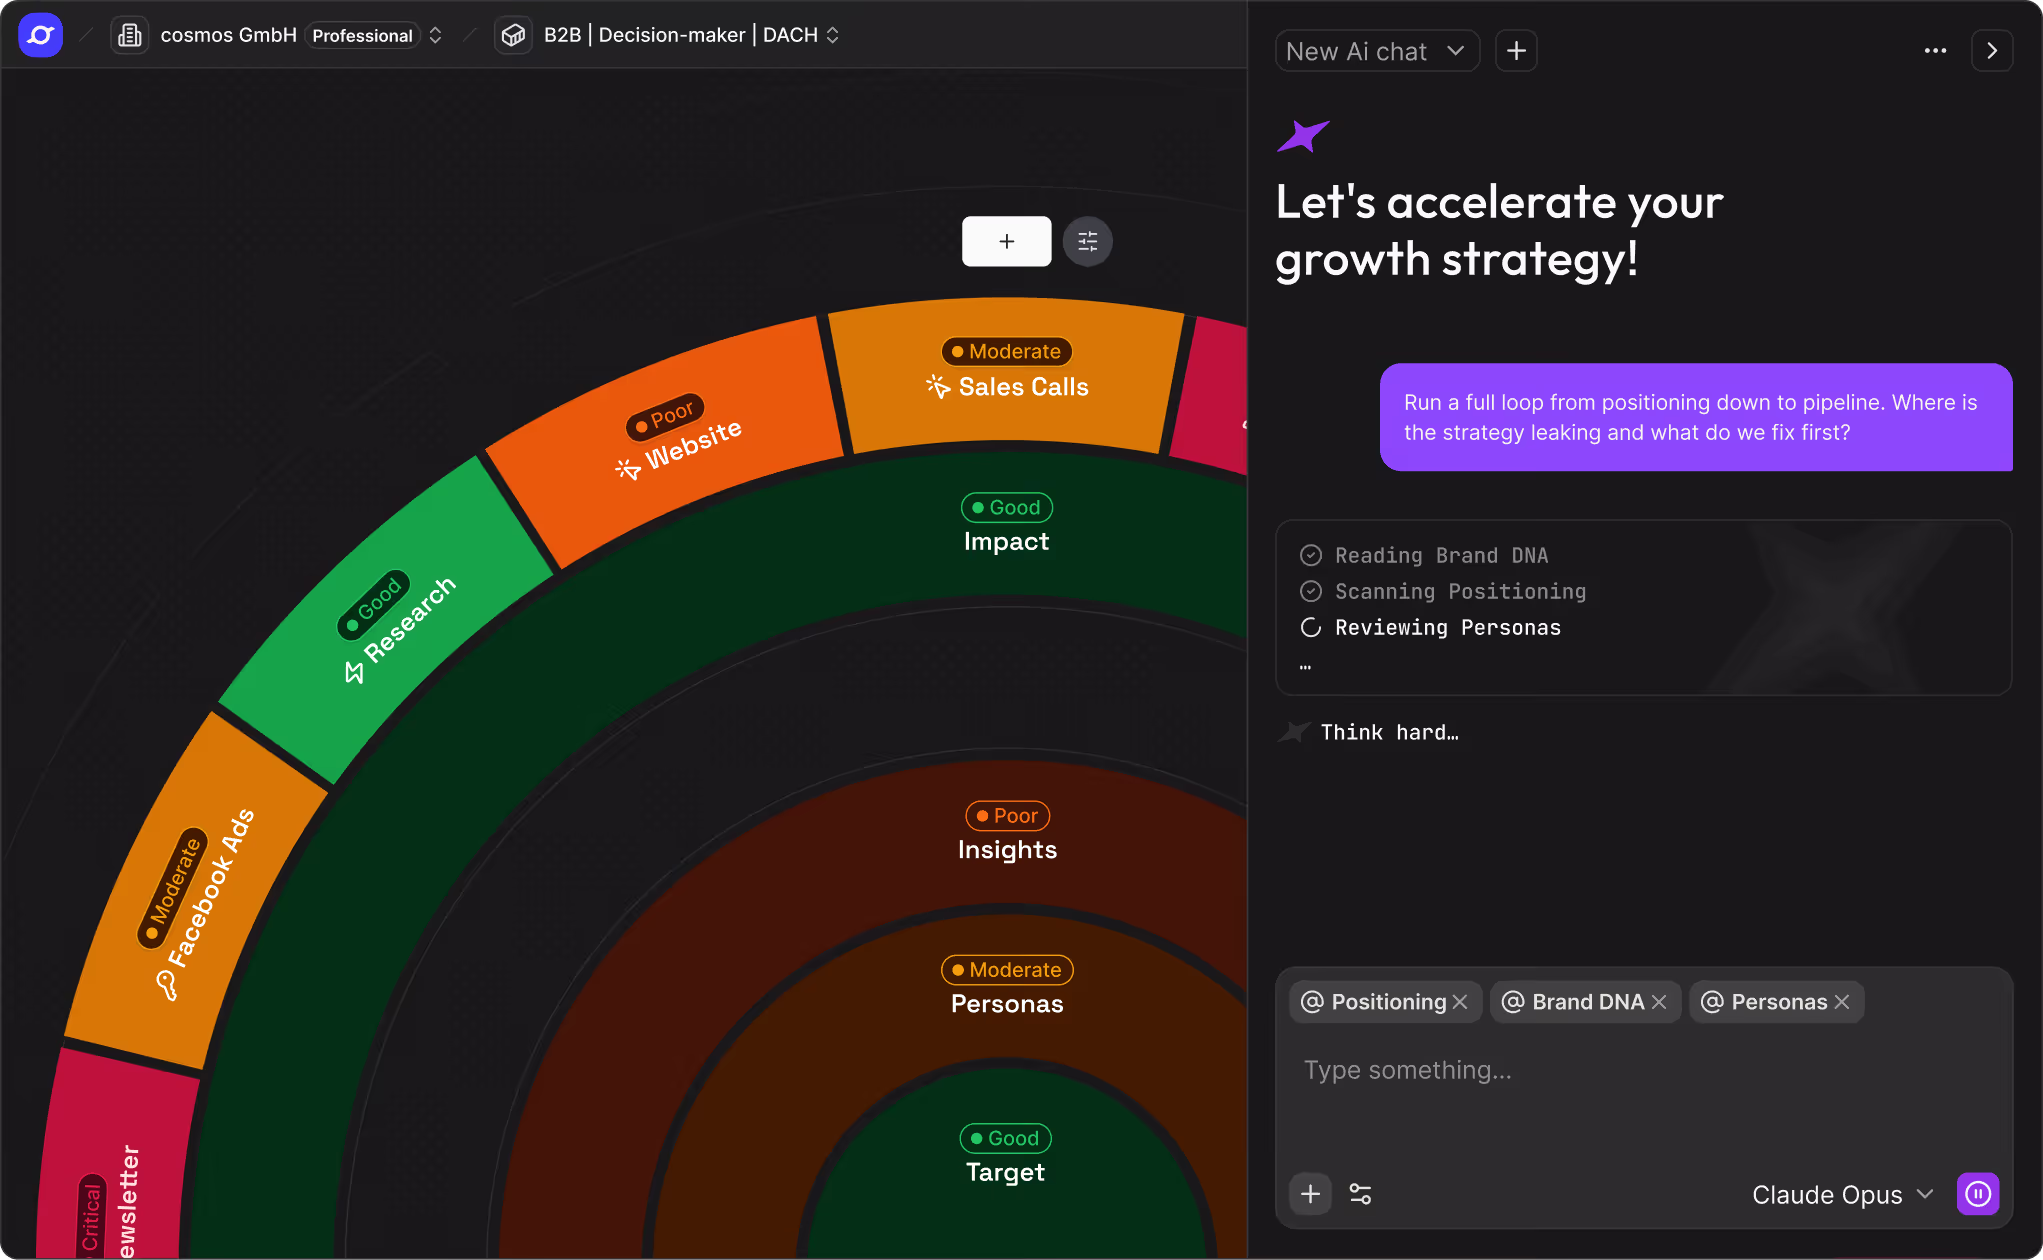
Free strategy audit
Find the gaps in your growth strategy
Somewhere between strategy and results, something gets lost. Find out where in 10 minutes – AI-powered, no commitment, no agency.